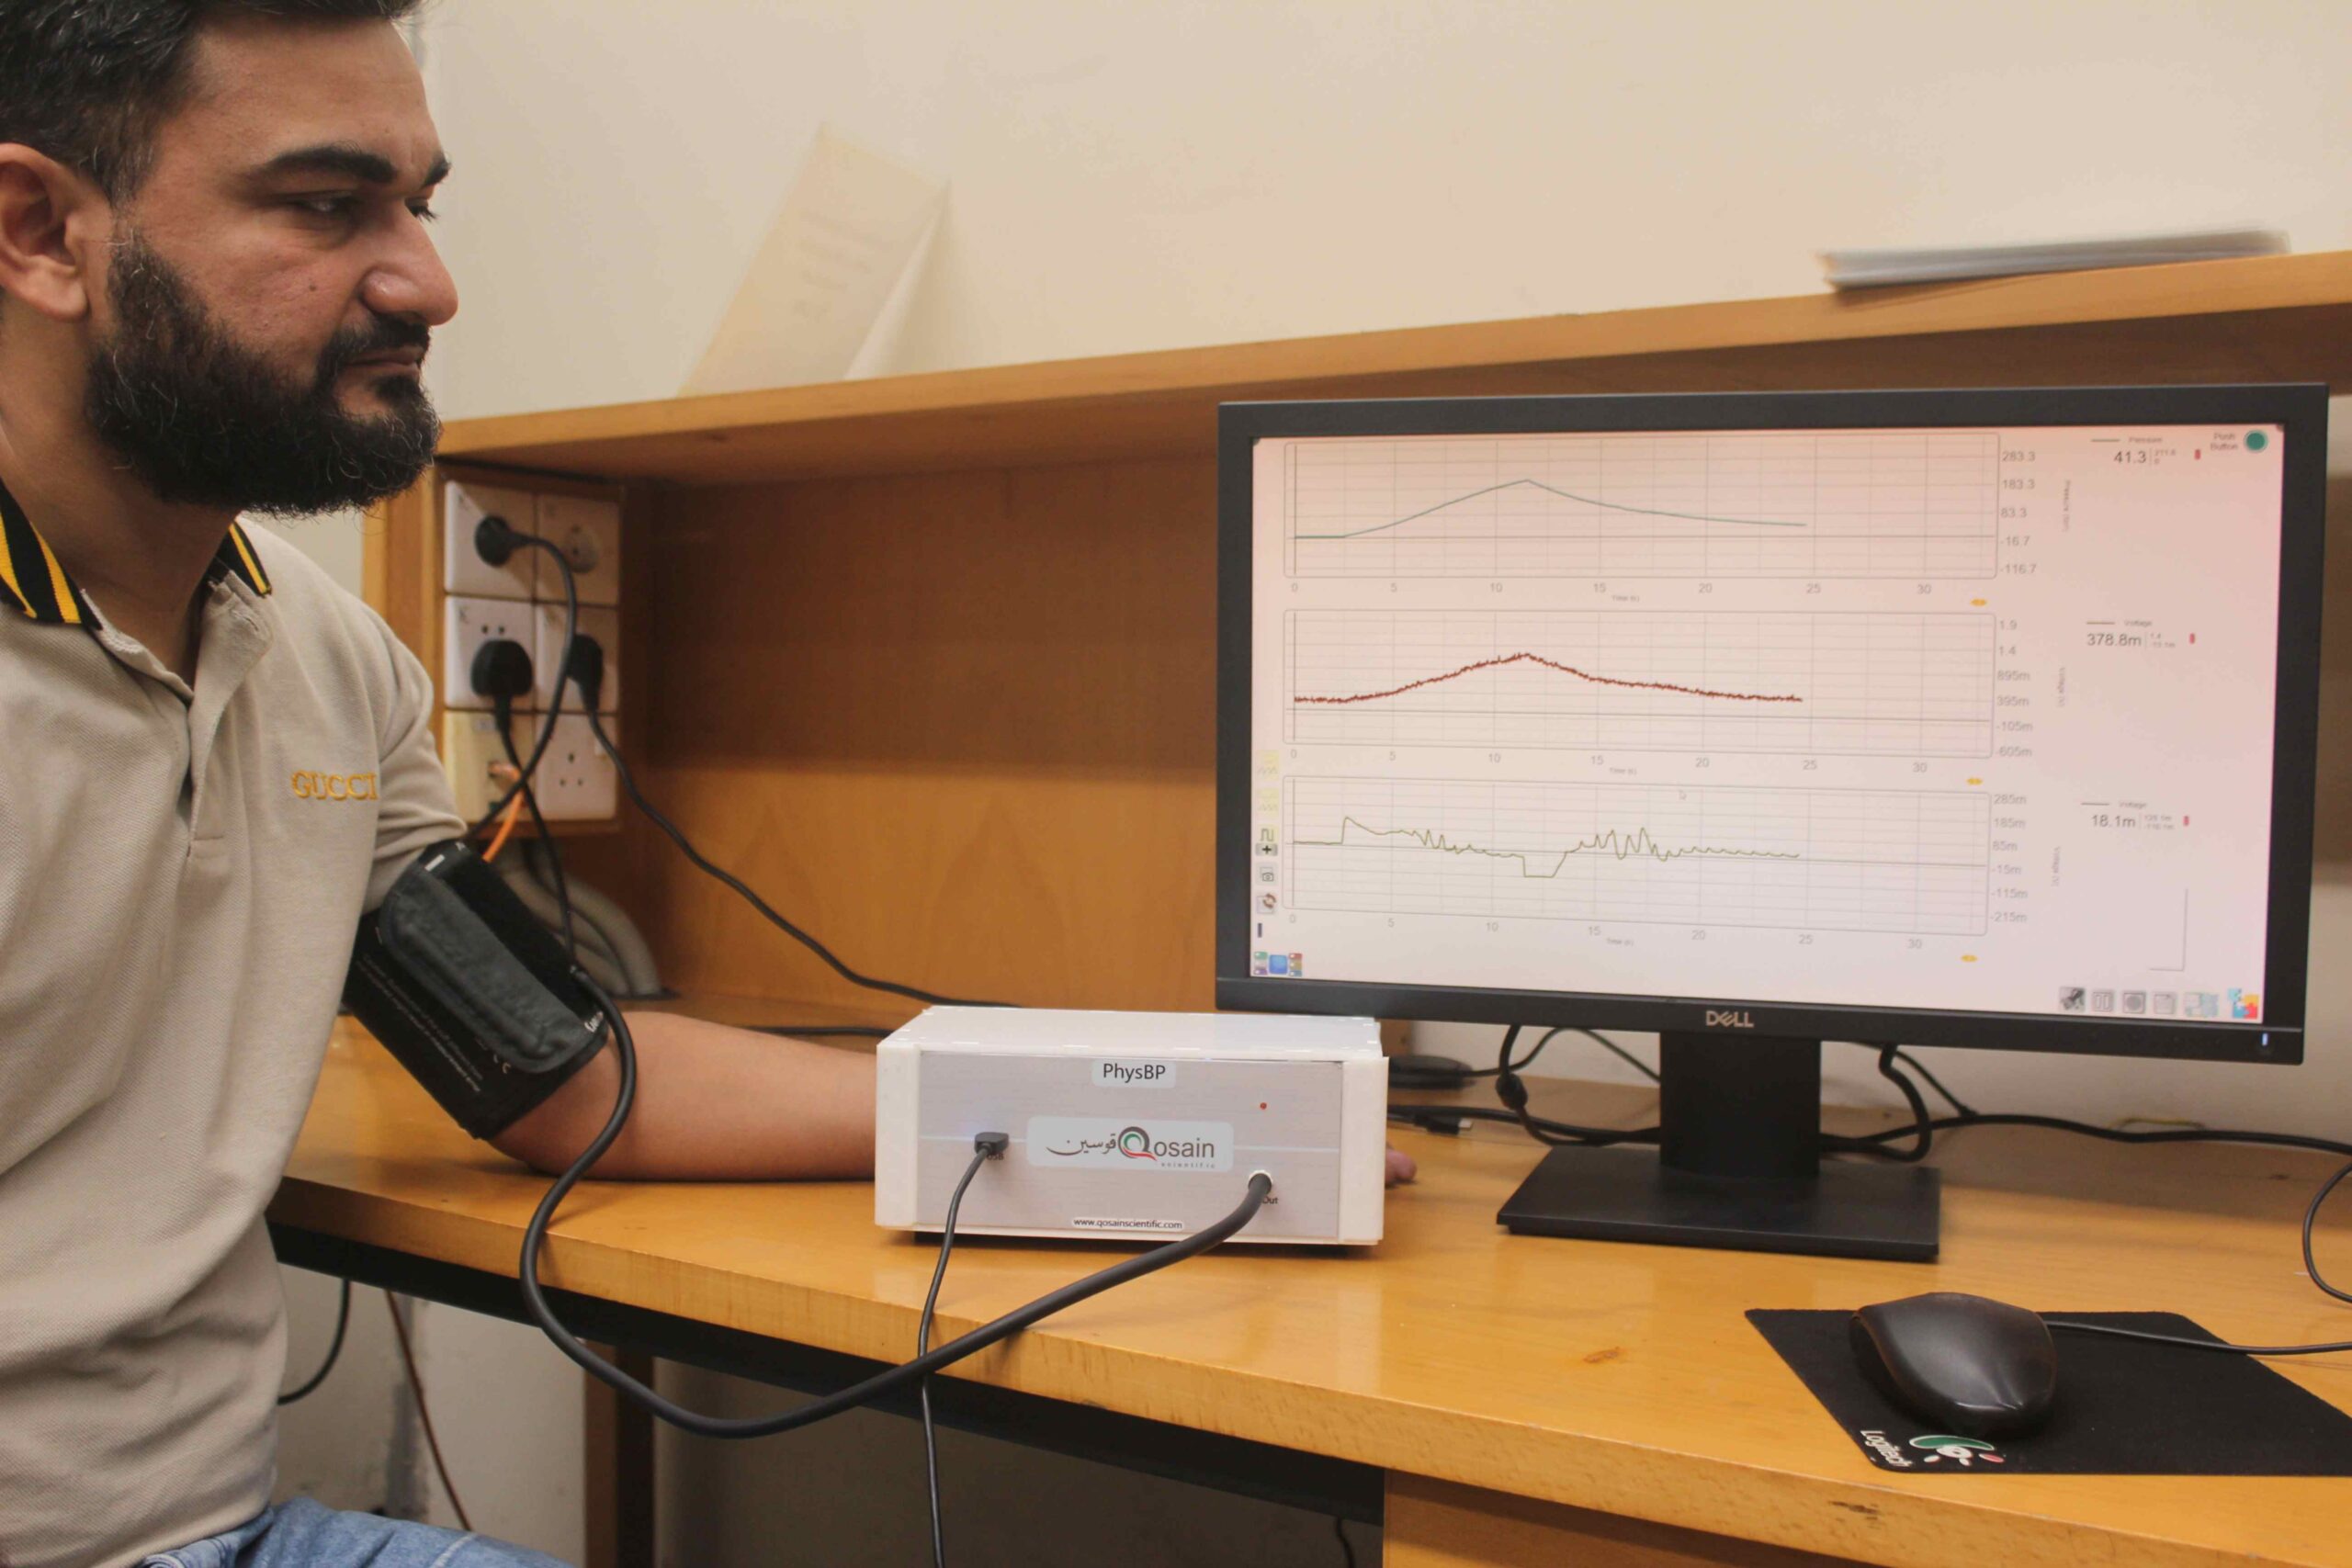
The PhysBP is compact device to measure the blood pressure and arterial oscillations. The setup is compact, portable and ideal to show case the phenomena behind the arterial oscillations due to movement of blood from heart to body parts through blood vessels, and to untie the knot of effect of internal and external pressure change.
It comprises of two pressure sensors: One is pre-calibrated called PhysBar to measure the cuff pressure with time and is interfaced with a circuit that cleans the signal and produces a digital signal that is read by the PhysLogger. The other analog pressure sensor to measure the arterial oscillations after filtering with time. Both the data can be seen in real time to visualize the effect of external pressure on artery pressure. The setup is integrated with our PhysLogger, a data logger with easy plug and play method. The PhysLogger is compatible with our own software PhysLogger Desktop to inspect the data in real time and to save the data for further analysis in some other platform.
Research and Education
Qosain Scientific’s PhysBP is a comprehensive and low cost device. It is compact and portable tool designed to see the key insights of external (cuff) and internal (arterial) pressure and teach students, researchers and the teachers itself, the physics behind the pressure in arteries due to heart pumping in the form of real time arterial oscillations during cuff inflation and deflation using PhysLogger through PhysLogger Desktop.
The arterial oscillations can become quantitative marker of arterial distensibility. Beside giving the deep insights, the PhysBP with updated curriculum also enables learners with:
data analysis using Python
data plotting
sensor calibration
importance of filters
estimating systolic and diastolic pressures
shape index
as well as comparing the arterial waveforms for different conditions i.e at resting, after physical activity, etc.
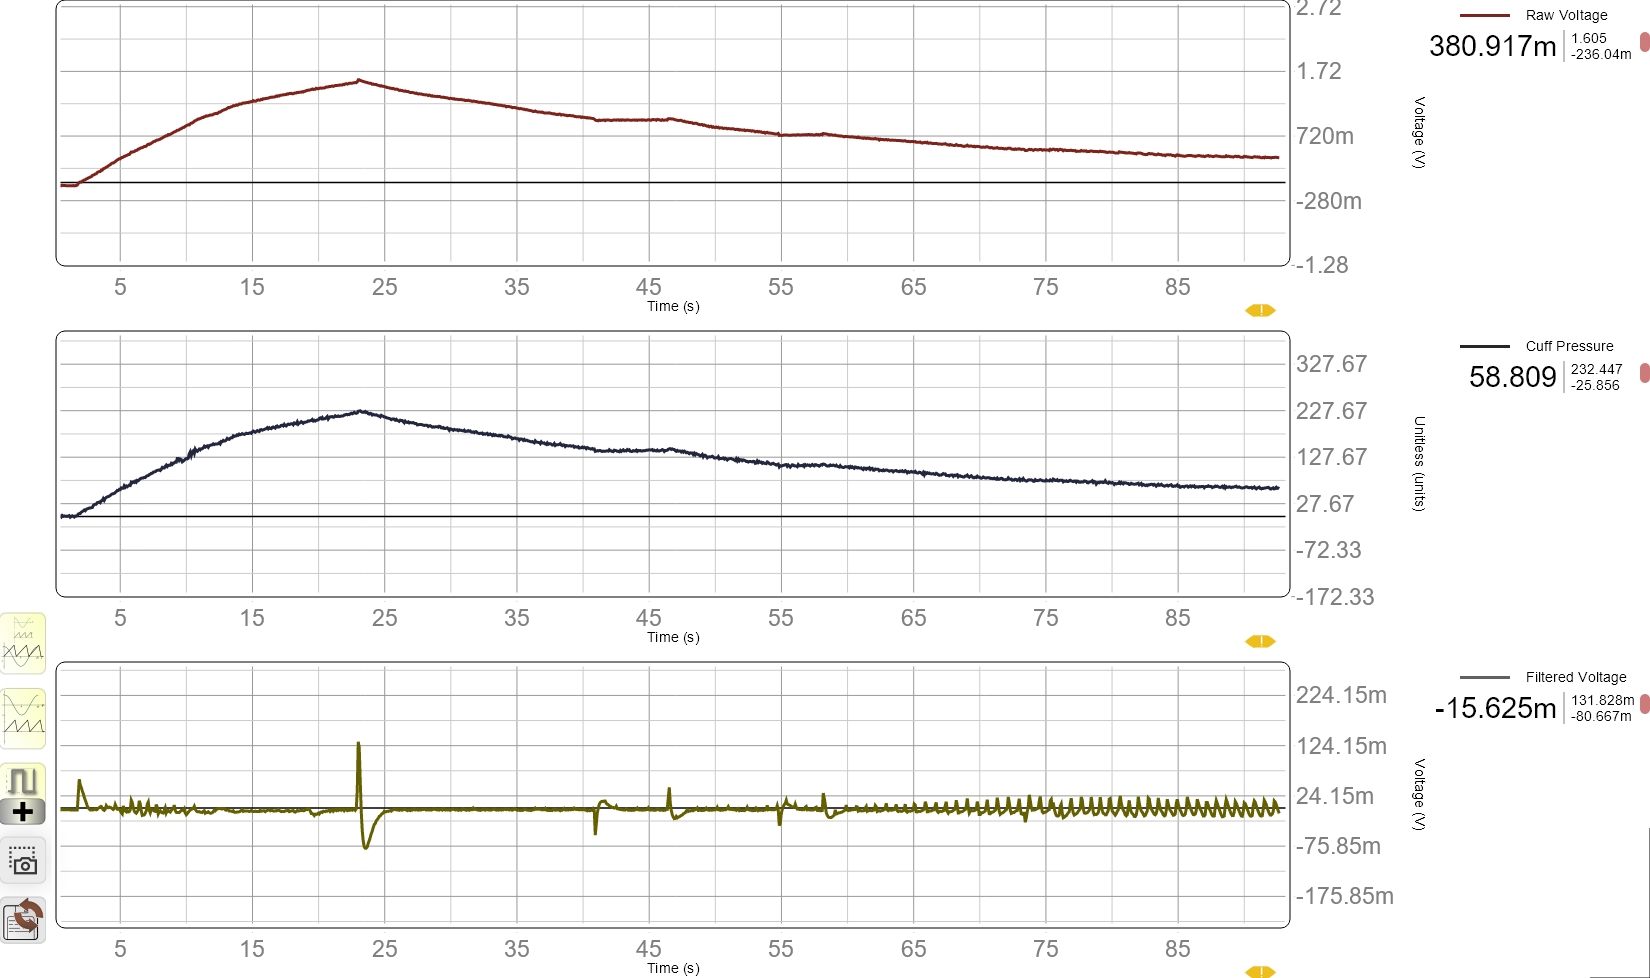
One of the key research and educational strengths of PhysBP is the ability to directly observe how arterial oscillations evolve during cuff deflation. The device allows to see the cuff pressure coming from PhysBar, and raw signal in voltage form through third party sensor. The arterial oscillations are riding on the top of this raw signal which is then filtered to have the required waveforms.
The graph shows data from PhysBP: (top) cuff pressure from PhysBar, (middle) raw signal from third party sensor and (bottom) filtered raw signal with arterial oscillations.
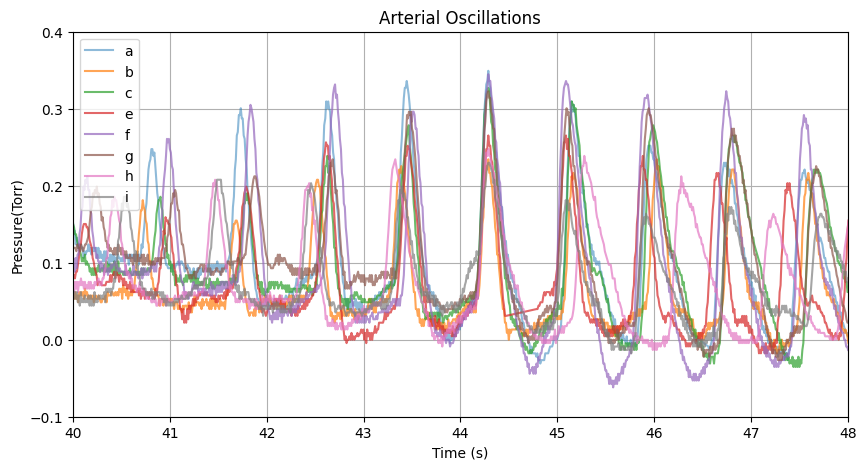
To explore more about the arterial waves, we collected data from same person for consecutive 8 days. The acquired data was analyzed within the meaningful range i.e when cuff pressure starts to deflate. The data below is in meaningful range and aligned at mean arterial pressures (MAP).
The figure shows the data for different days from same person with normal body state i.e calm and seated.
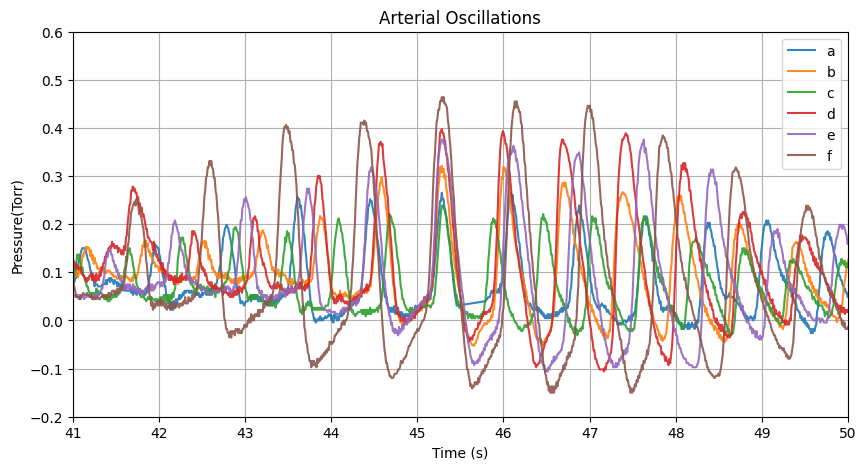
The graph below compares oscillations recorded from different individuals with age ranges 20-80 years. The patterns clearly demonstrate differences in oscillation amplitude distribution. Such comparisons allow students and researchers to study oscillometric behavior and explore how arterial properties influence measured signals.
The graph shows the variation in the amplitude of arterial oscillations with increase in age from 25-72 as we move through the waveforms labelled a-f, respectively at resting and seated position.
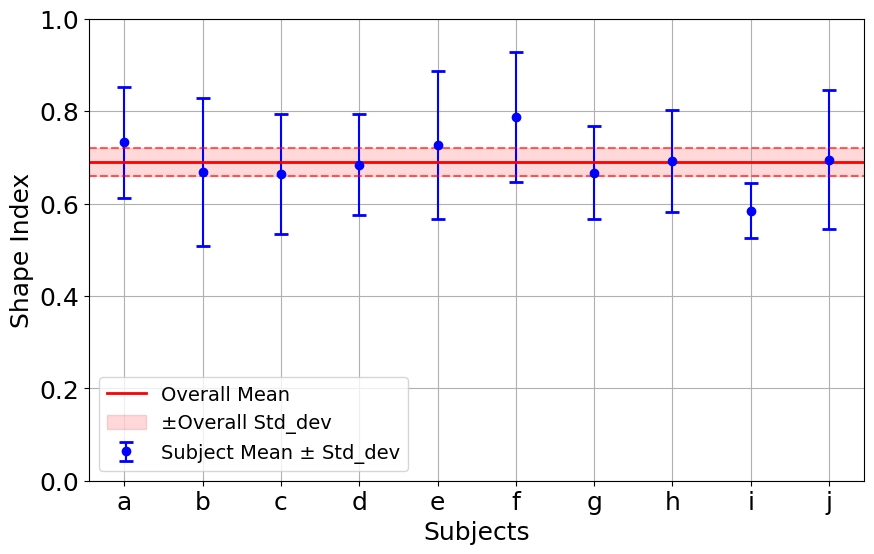
From these arterial oscillations, one can find the shape index to assure the data credibility over the different number of days. The figure below shows the shape index for each individual data recorded over 8-9 consecutive days aged between 20-72 years and overall shape index for better data quality check. The results highlight the consistency, repeatability, and dependability across all ages. The shape index parameter gives valuable insight and highlights the credibility of the device to be used in research and education domain.
Shape index values are shown per subject with the overall mean and standard deviation envelope indicating measurement repeatability.
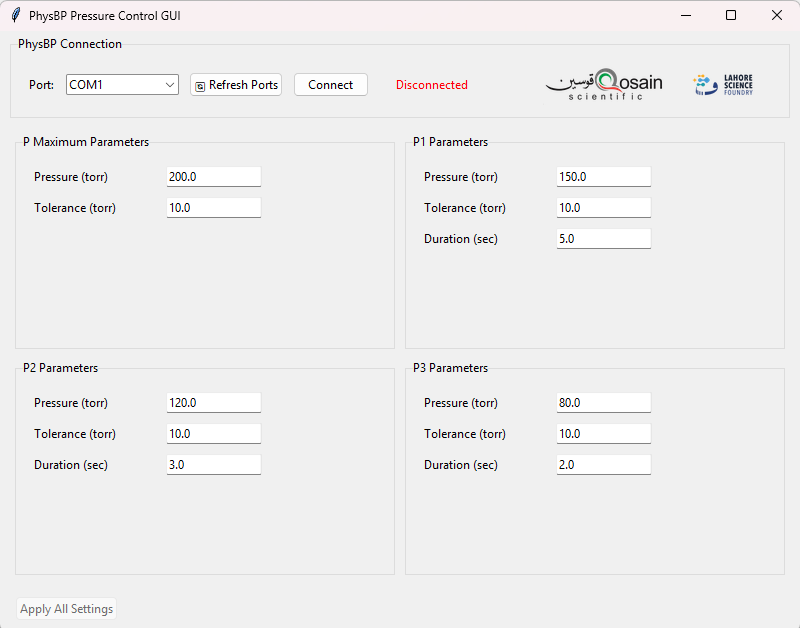
PhysBP can be customized on demand according to user needs. One upgradation is pressure control integration to hold pressure at pre-defined user values. This allows researchers to explore the arterial oscillations under constant pressure as well.
The figure illustrate arterial oscillations under pressure controlled configuration at three different adjustable pressure values.
The pressure customization is all done through a simple user interface. It allows to set maximum cuff pressure and three configurable pressure hold values.