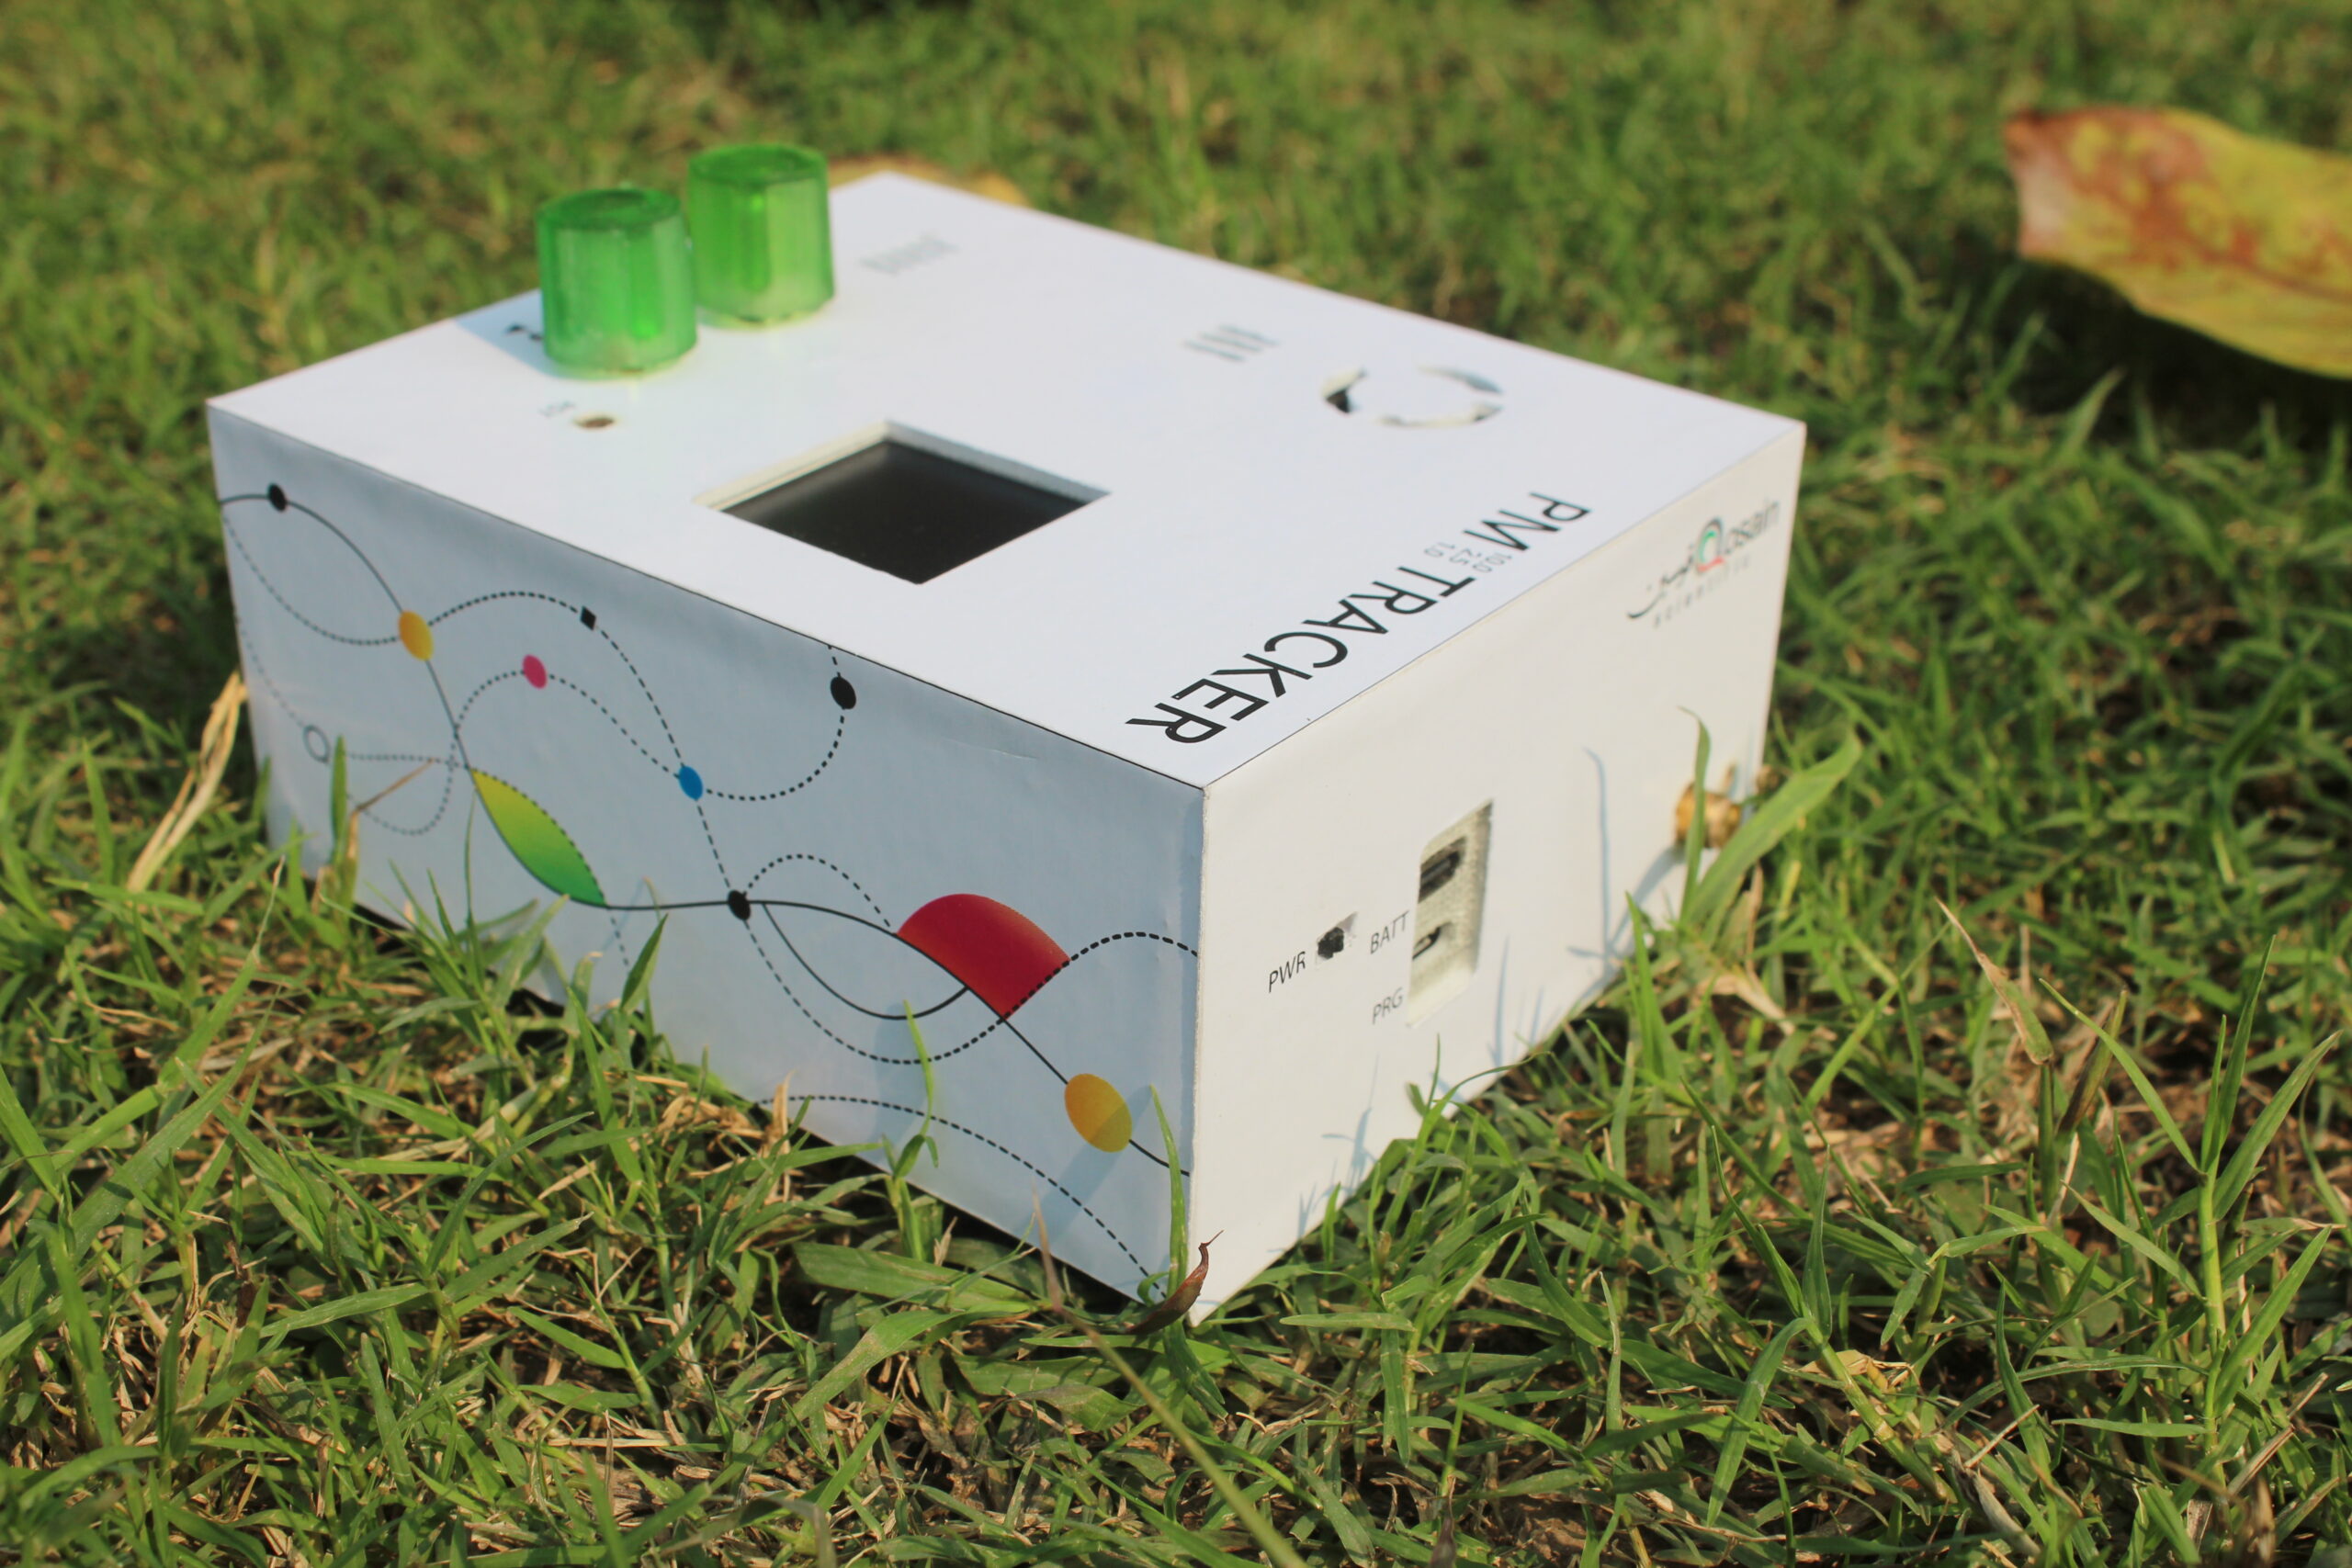
The Qosain Scientific PM Tracker Device is a comprehensive tool designed to monitor environmental parameters in
real-time. It measures PM1.0, PM2.5, PM10.0 (concentrations of particulate matter smaller than 1.0, 2.5 and 10.0 µ
respectively), NOx, CO2, NH4, temperature, and humidity, providing accurate data for research, urban monitoring,
and industrial applications. The device features an OLED display, a web interface, continuous data logging to an
SD card, and integration with Google Sheets for remote data storage and visualization.
Data Logging: Continuous storage on SD card and Google Sheets integration.
Interactive Plots: Graphs with zoom, axis adjustments, and screenshots.
Power Options: USB 5V or integrated battery.
Custom Timestamp: GPS/manual selection.
Email Alerts: Automated AQI status updates and threshold breach notifications.
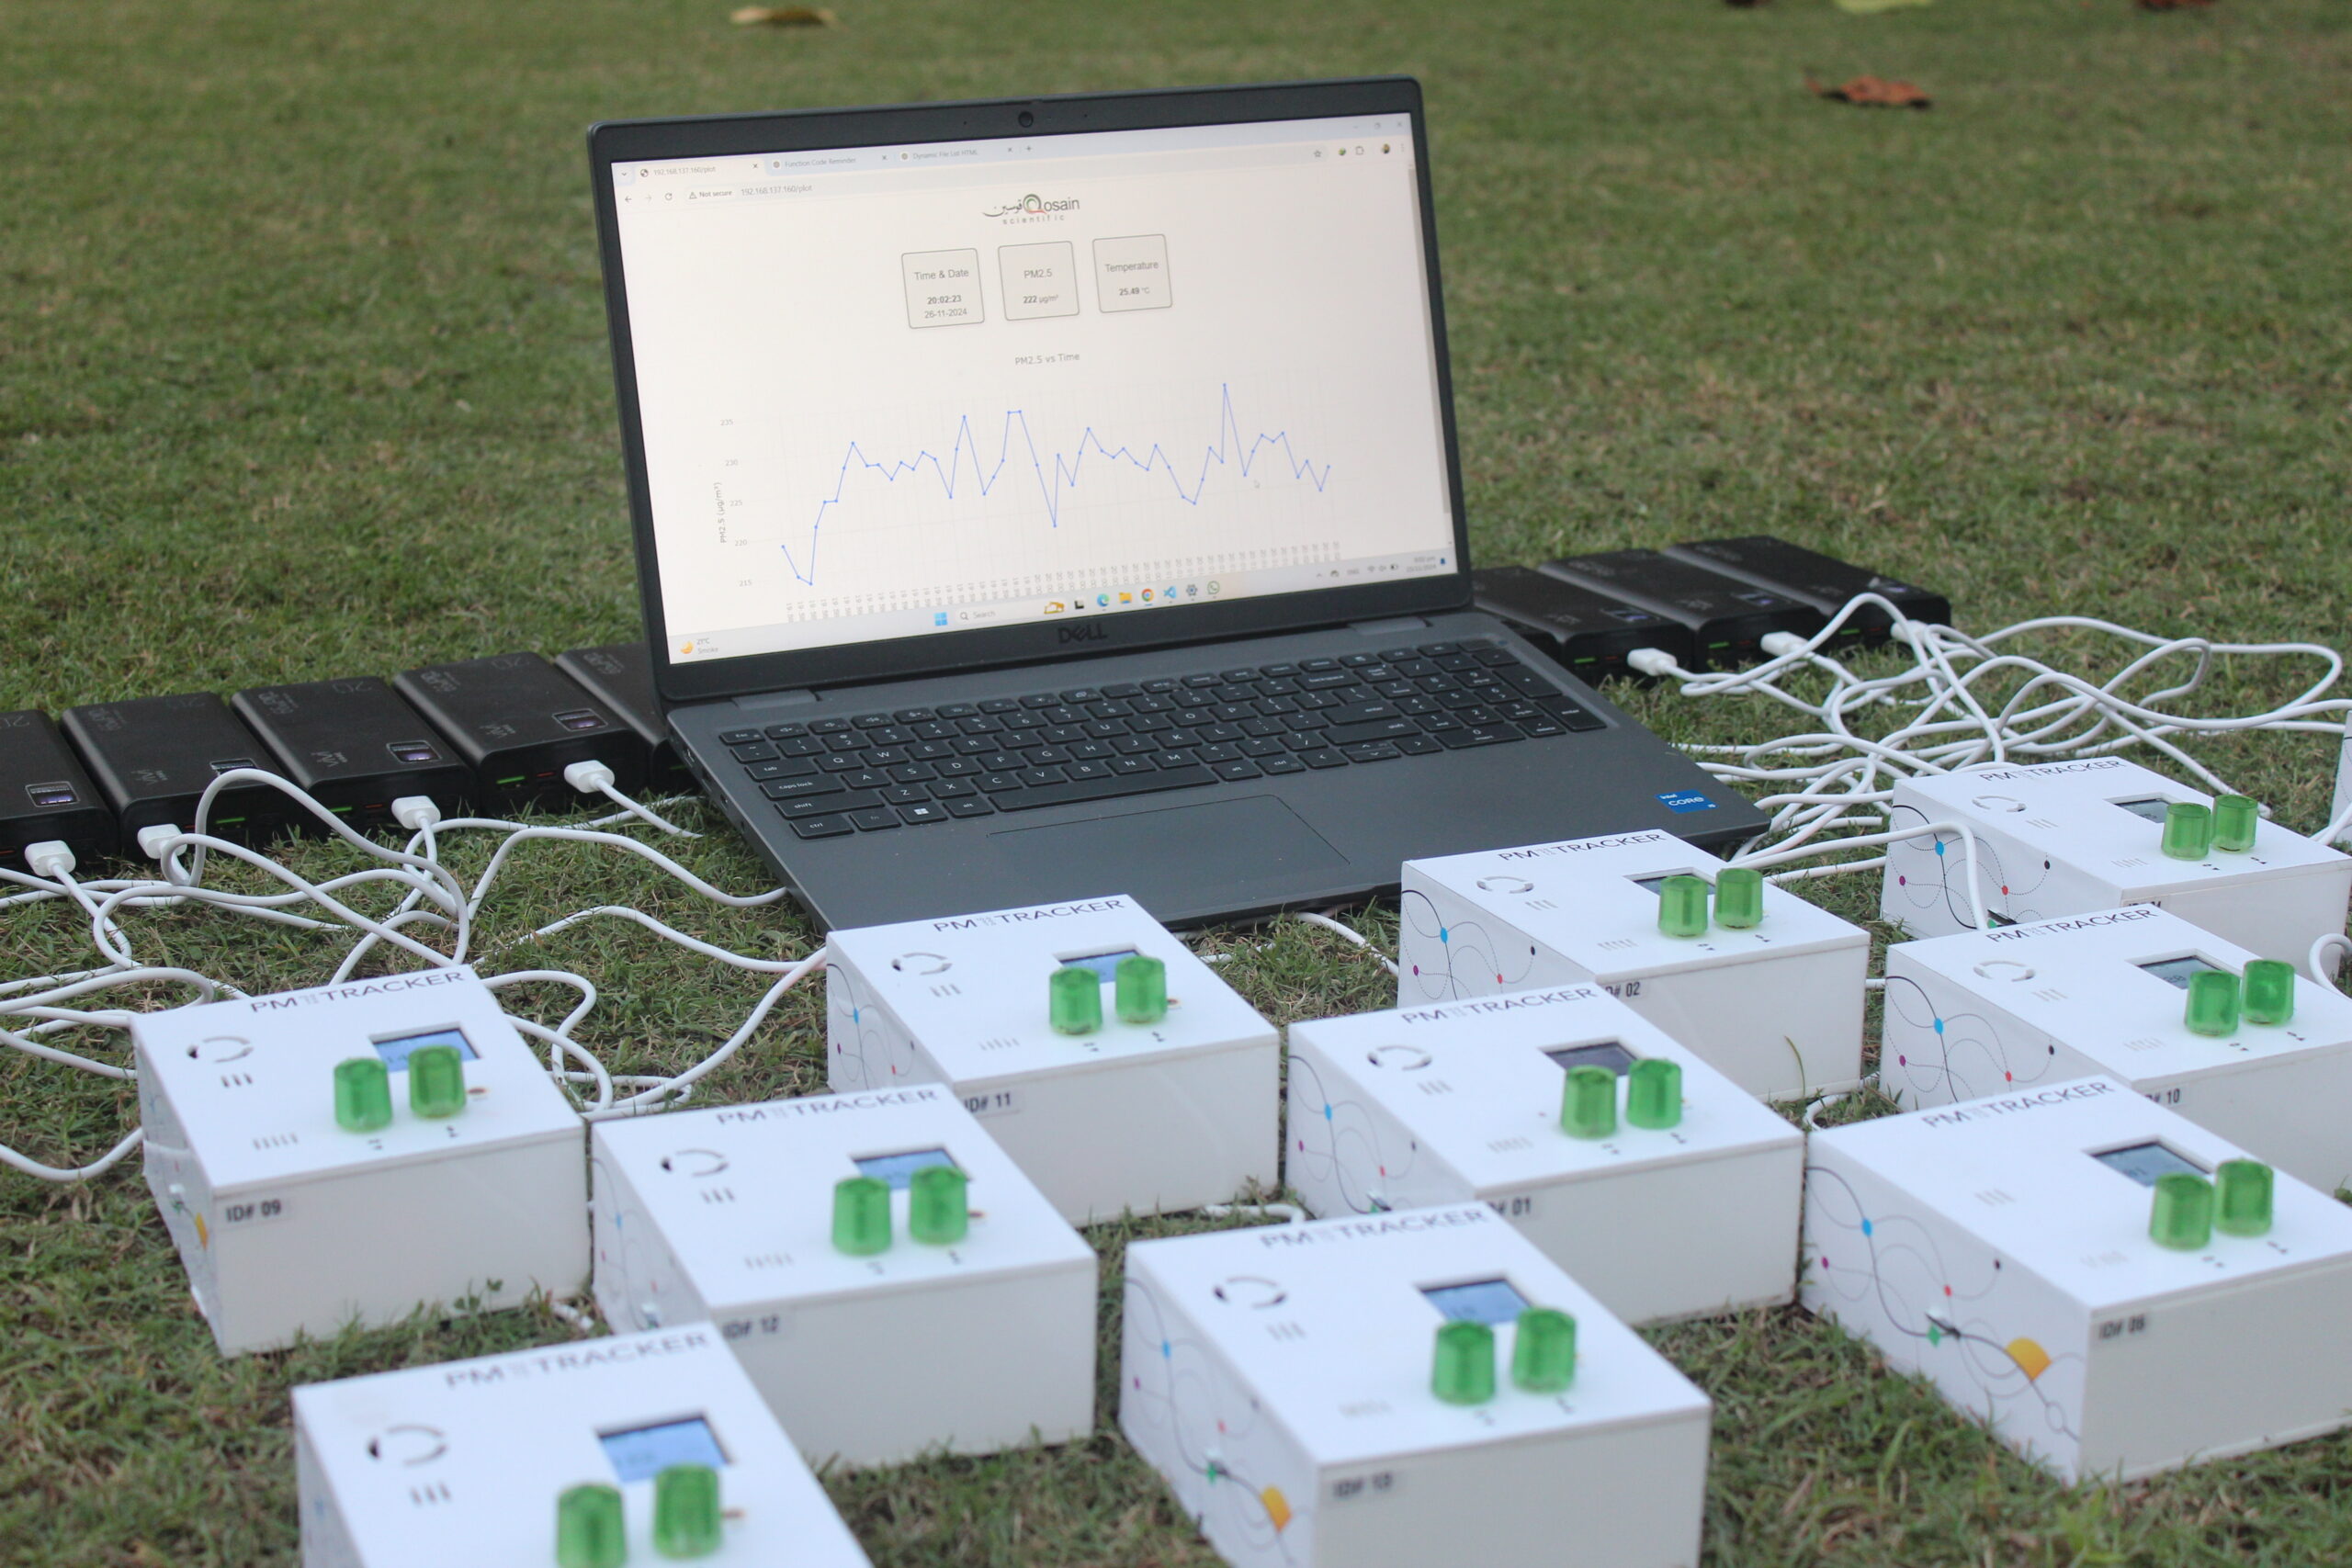
Network of Devices: For assistance with setting up and managing a network of multiple devices, please reach out to Qosain Scientific for tailored solutions and support
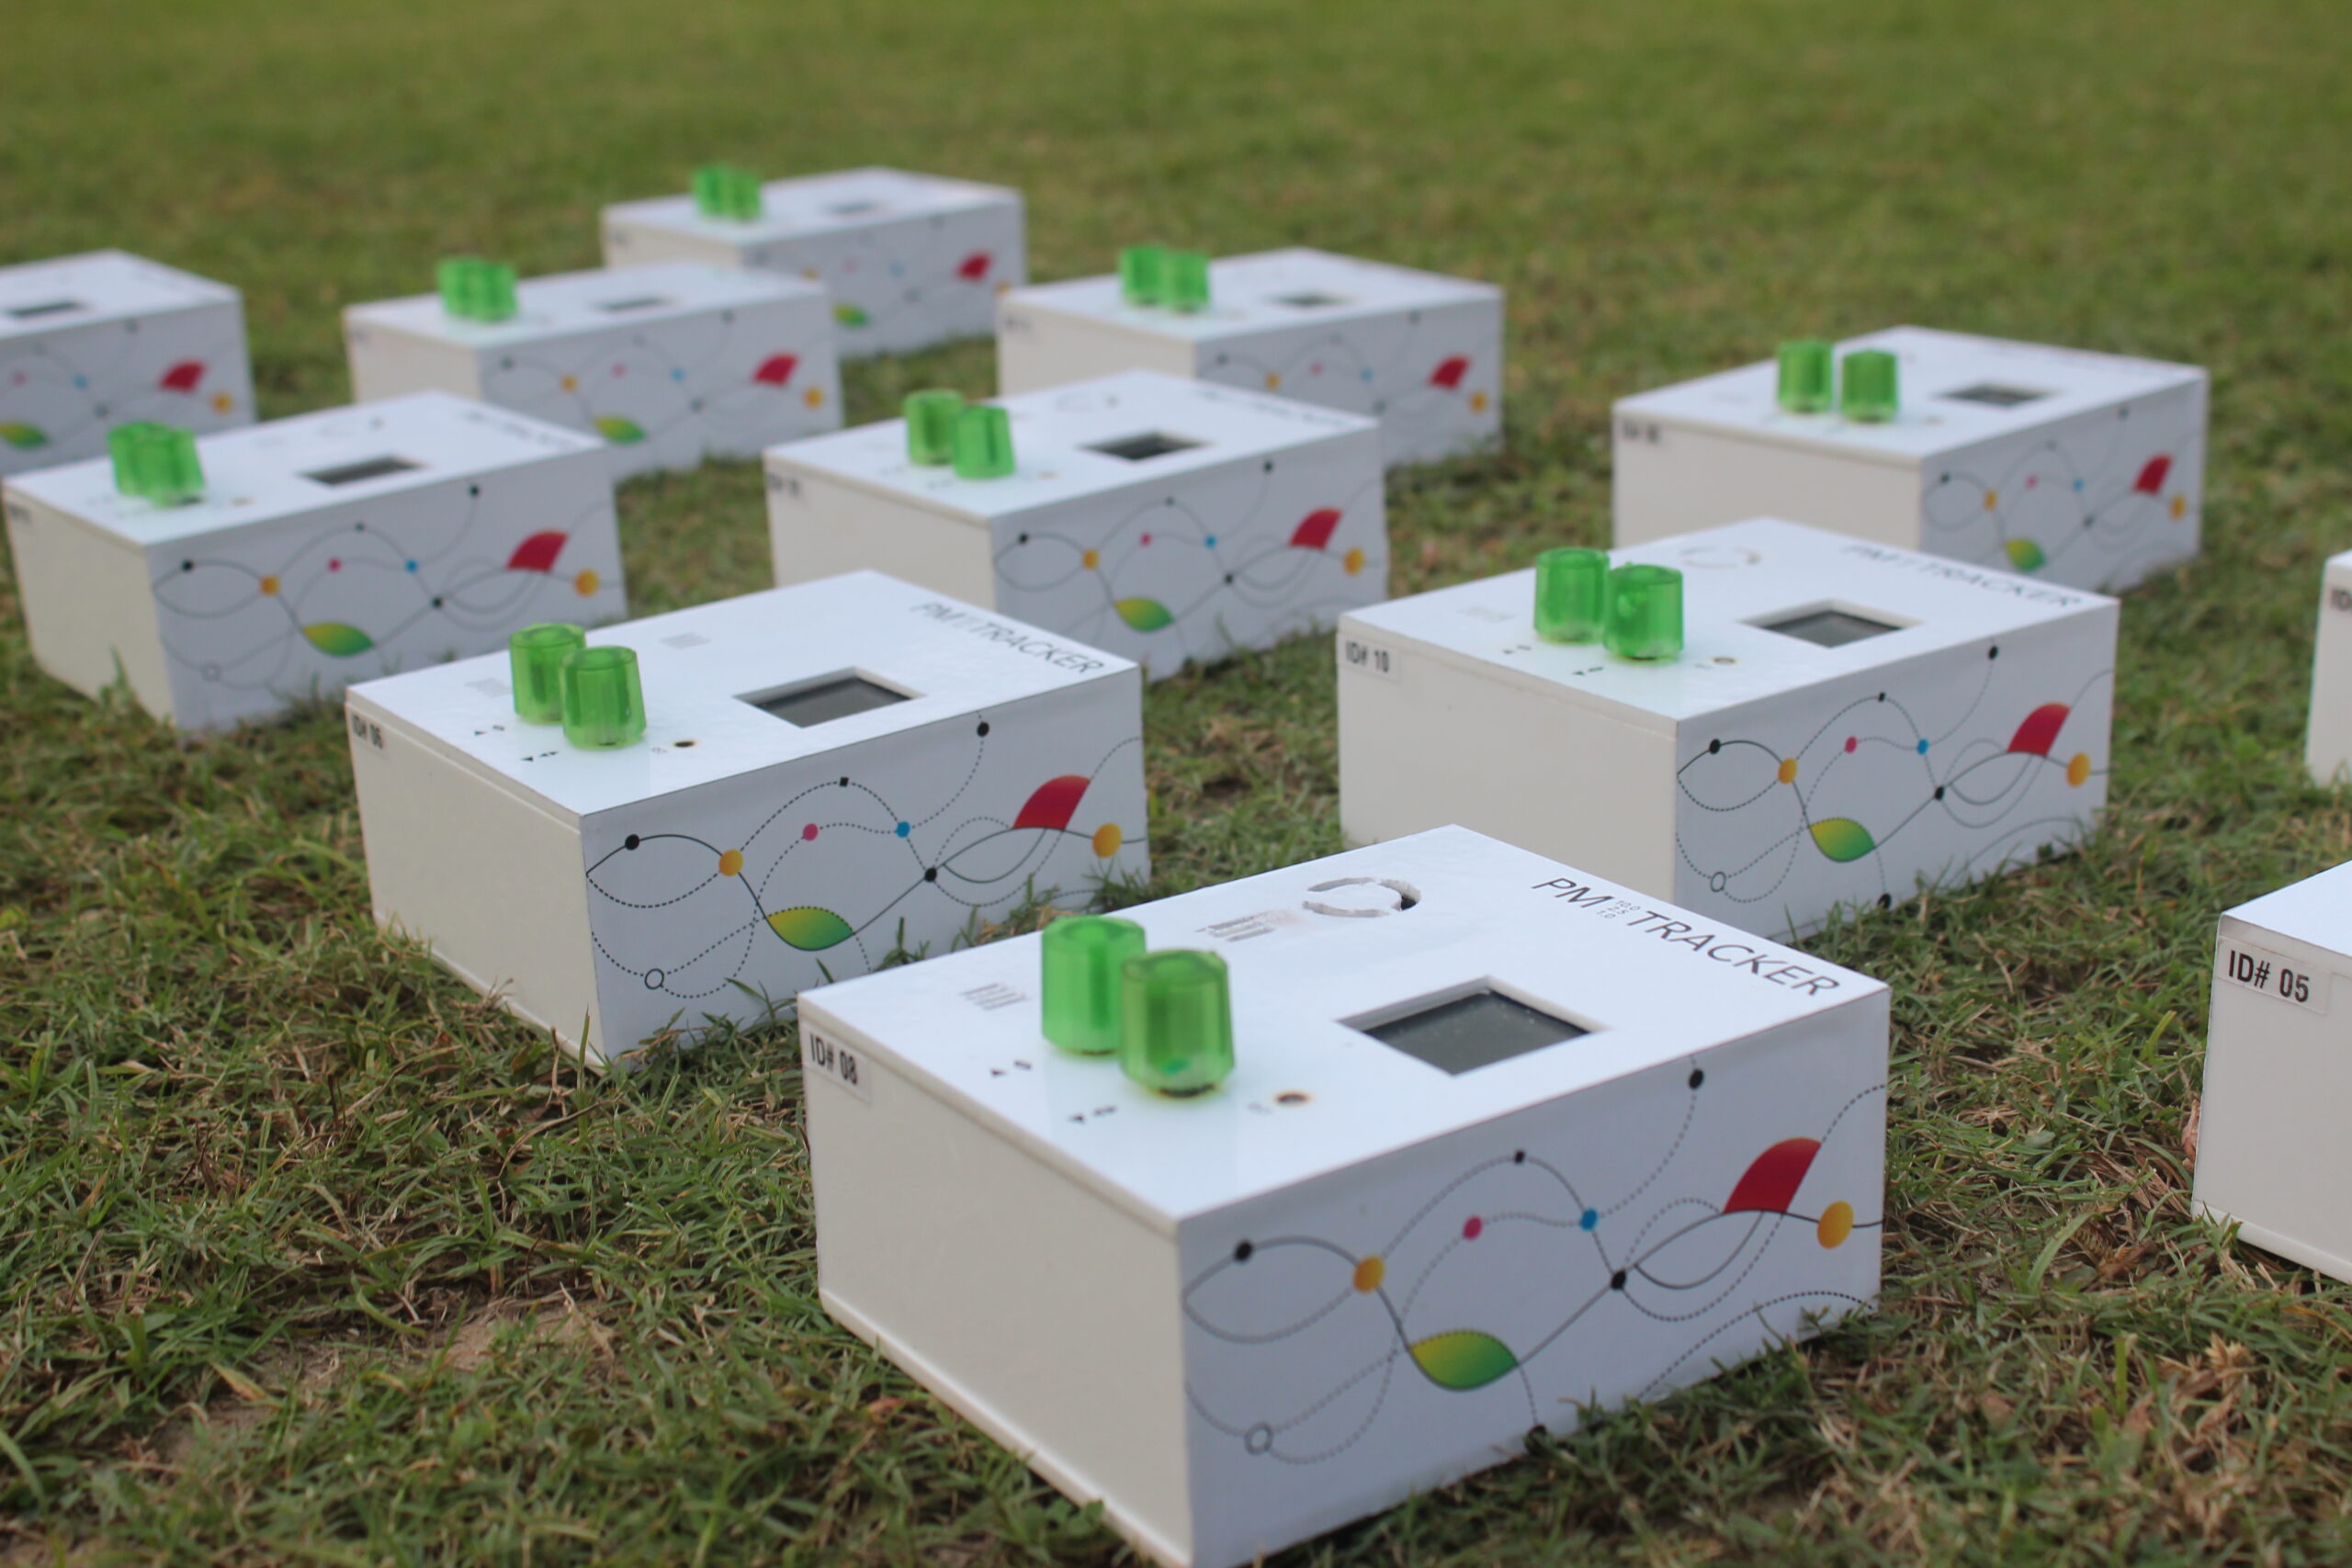
Experience the magic of this product — a vital highlight of our Phenomenon Lab, featured at major science event across Pakistan, the Lahore Science Mela (LSM) organized by the Khwarizmi Science Society (KSS). This instrument highlights the unseen threats in our air, encouraging healthier choices for people and the planet.
Qosain Scientific’s PM trackers are an ideal low-cost sensor for research and education. They can be easily deployed as a network, connected with the wifi for live display and logging of data from multiple locations, all in synchroneity. Therefore, one can easily build an air quality mapping network at your school, college, university, inside your hospital, office or over wide distributed metropolitan locations. These sensors are ideal source of data for air quality, based on particulate matter, gas concentration, temperature and humidity.
The PM trackers are available to school members of the Khwarizmi Science Society at 70% discounted rates. These trackers also come with a refreshing curriculum that exposes students to techniques in:
statistics
data analysis
plotting trends
comparing sensors
as well as sensitizing students and citizens about air quality, climate, air pollution and its impacts on health. Furthermore, data can be acquired over long-time courses enabling correlations with season, time of the day, degree of anthropic activity and the prevalence of smog in certain geographical locations including Pakistan.
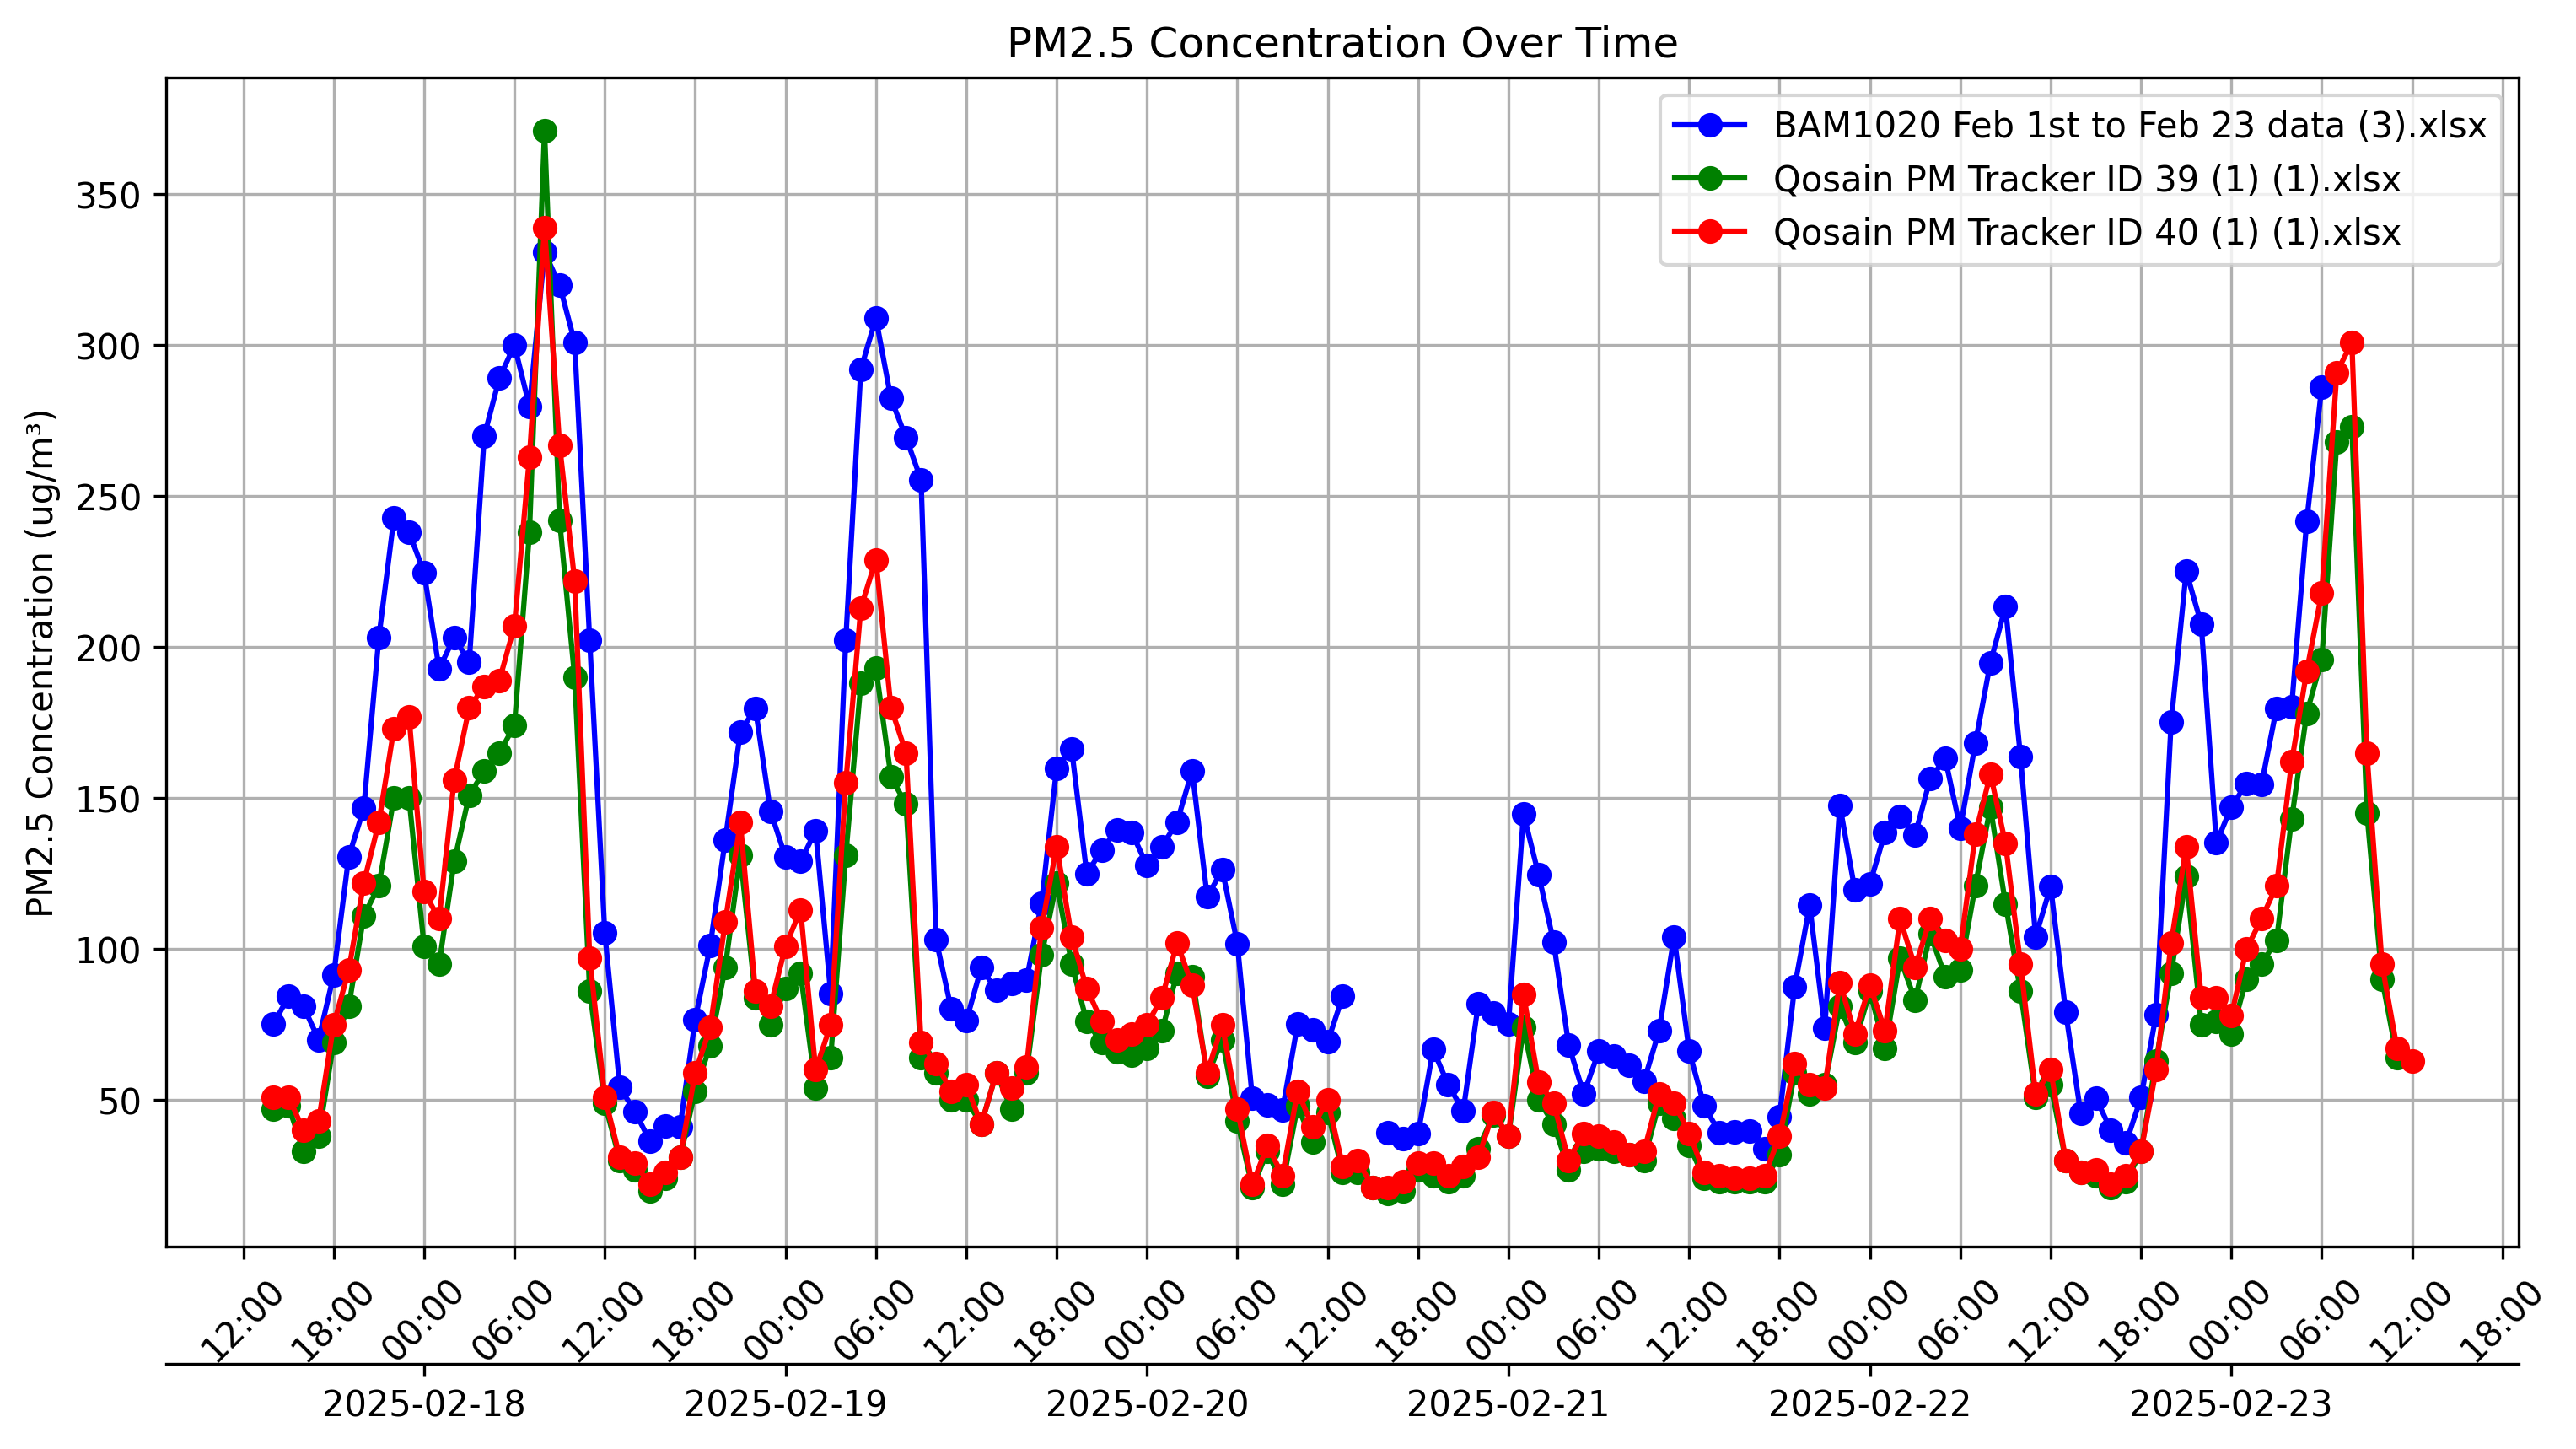
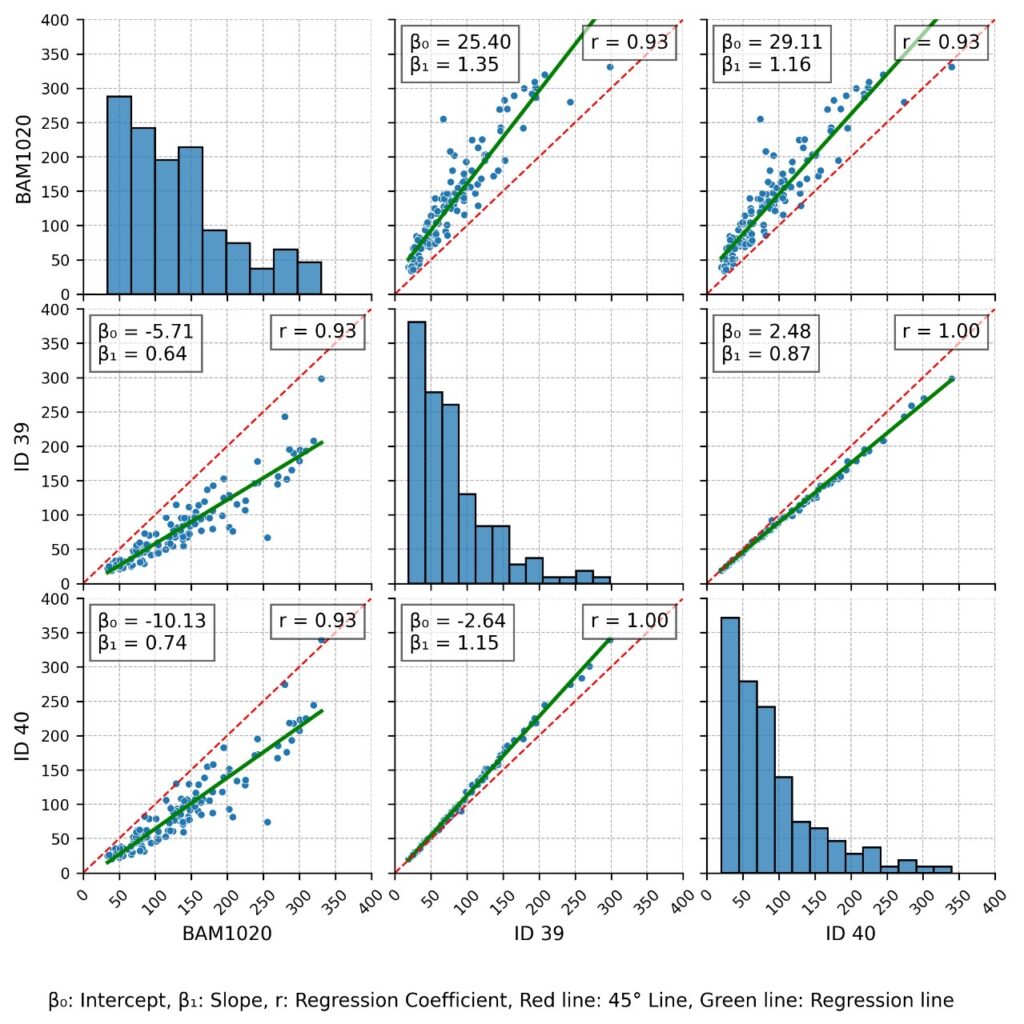
In February and March 2025, we were able to compare the fidelity of data by collocating two PM trackers with a BAM 1020 (beta attenuation mass monitor) installed at the premises of the Urban unit in Punjab Civil Secretariat ad certified with the USEPA as a “fixed station”. Data reproduced below shows the degree of correlation between two PM trackers as well as with the BAM standard.
Comparison of data acquired from PM trackers ID’s 39 and 40 at the BAM sensor situated at the Punjab Civil Secretariat.
Shown below is the correlogram between two of our sensors (ID39 and ID40) correlated with the BAM 1020, showing excellent linearity and exposing limits where our sensors can deviate from third party sources.
Over the months, students and researchers have employed PM trackers for visualizing various scenarios such as proximity to highways, mapping kitchen and cooking activity enabling studies on indoor microclimates, exposure to fume emissions from vehicles, welding and soldering activity, crop burning situations in agricultural fields as well as correlation with weather conditions, notably temperature and humidity. The detection of NOx and CO2 also yields valuable additional information about hazards associated with these gases.
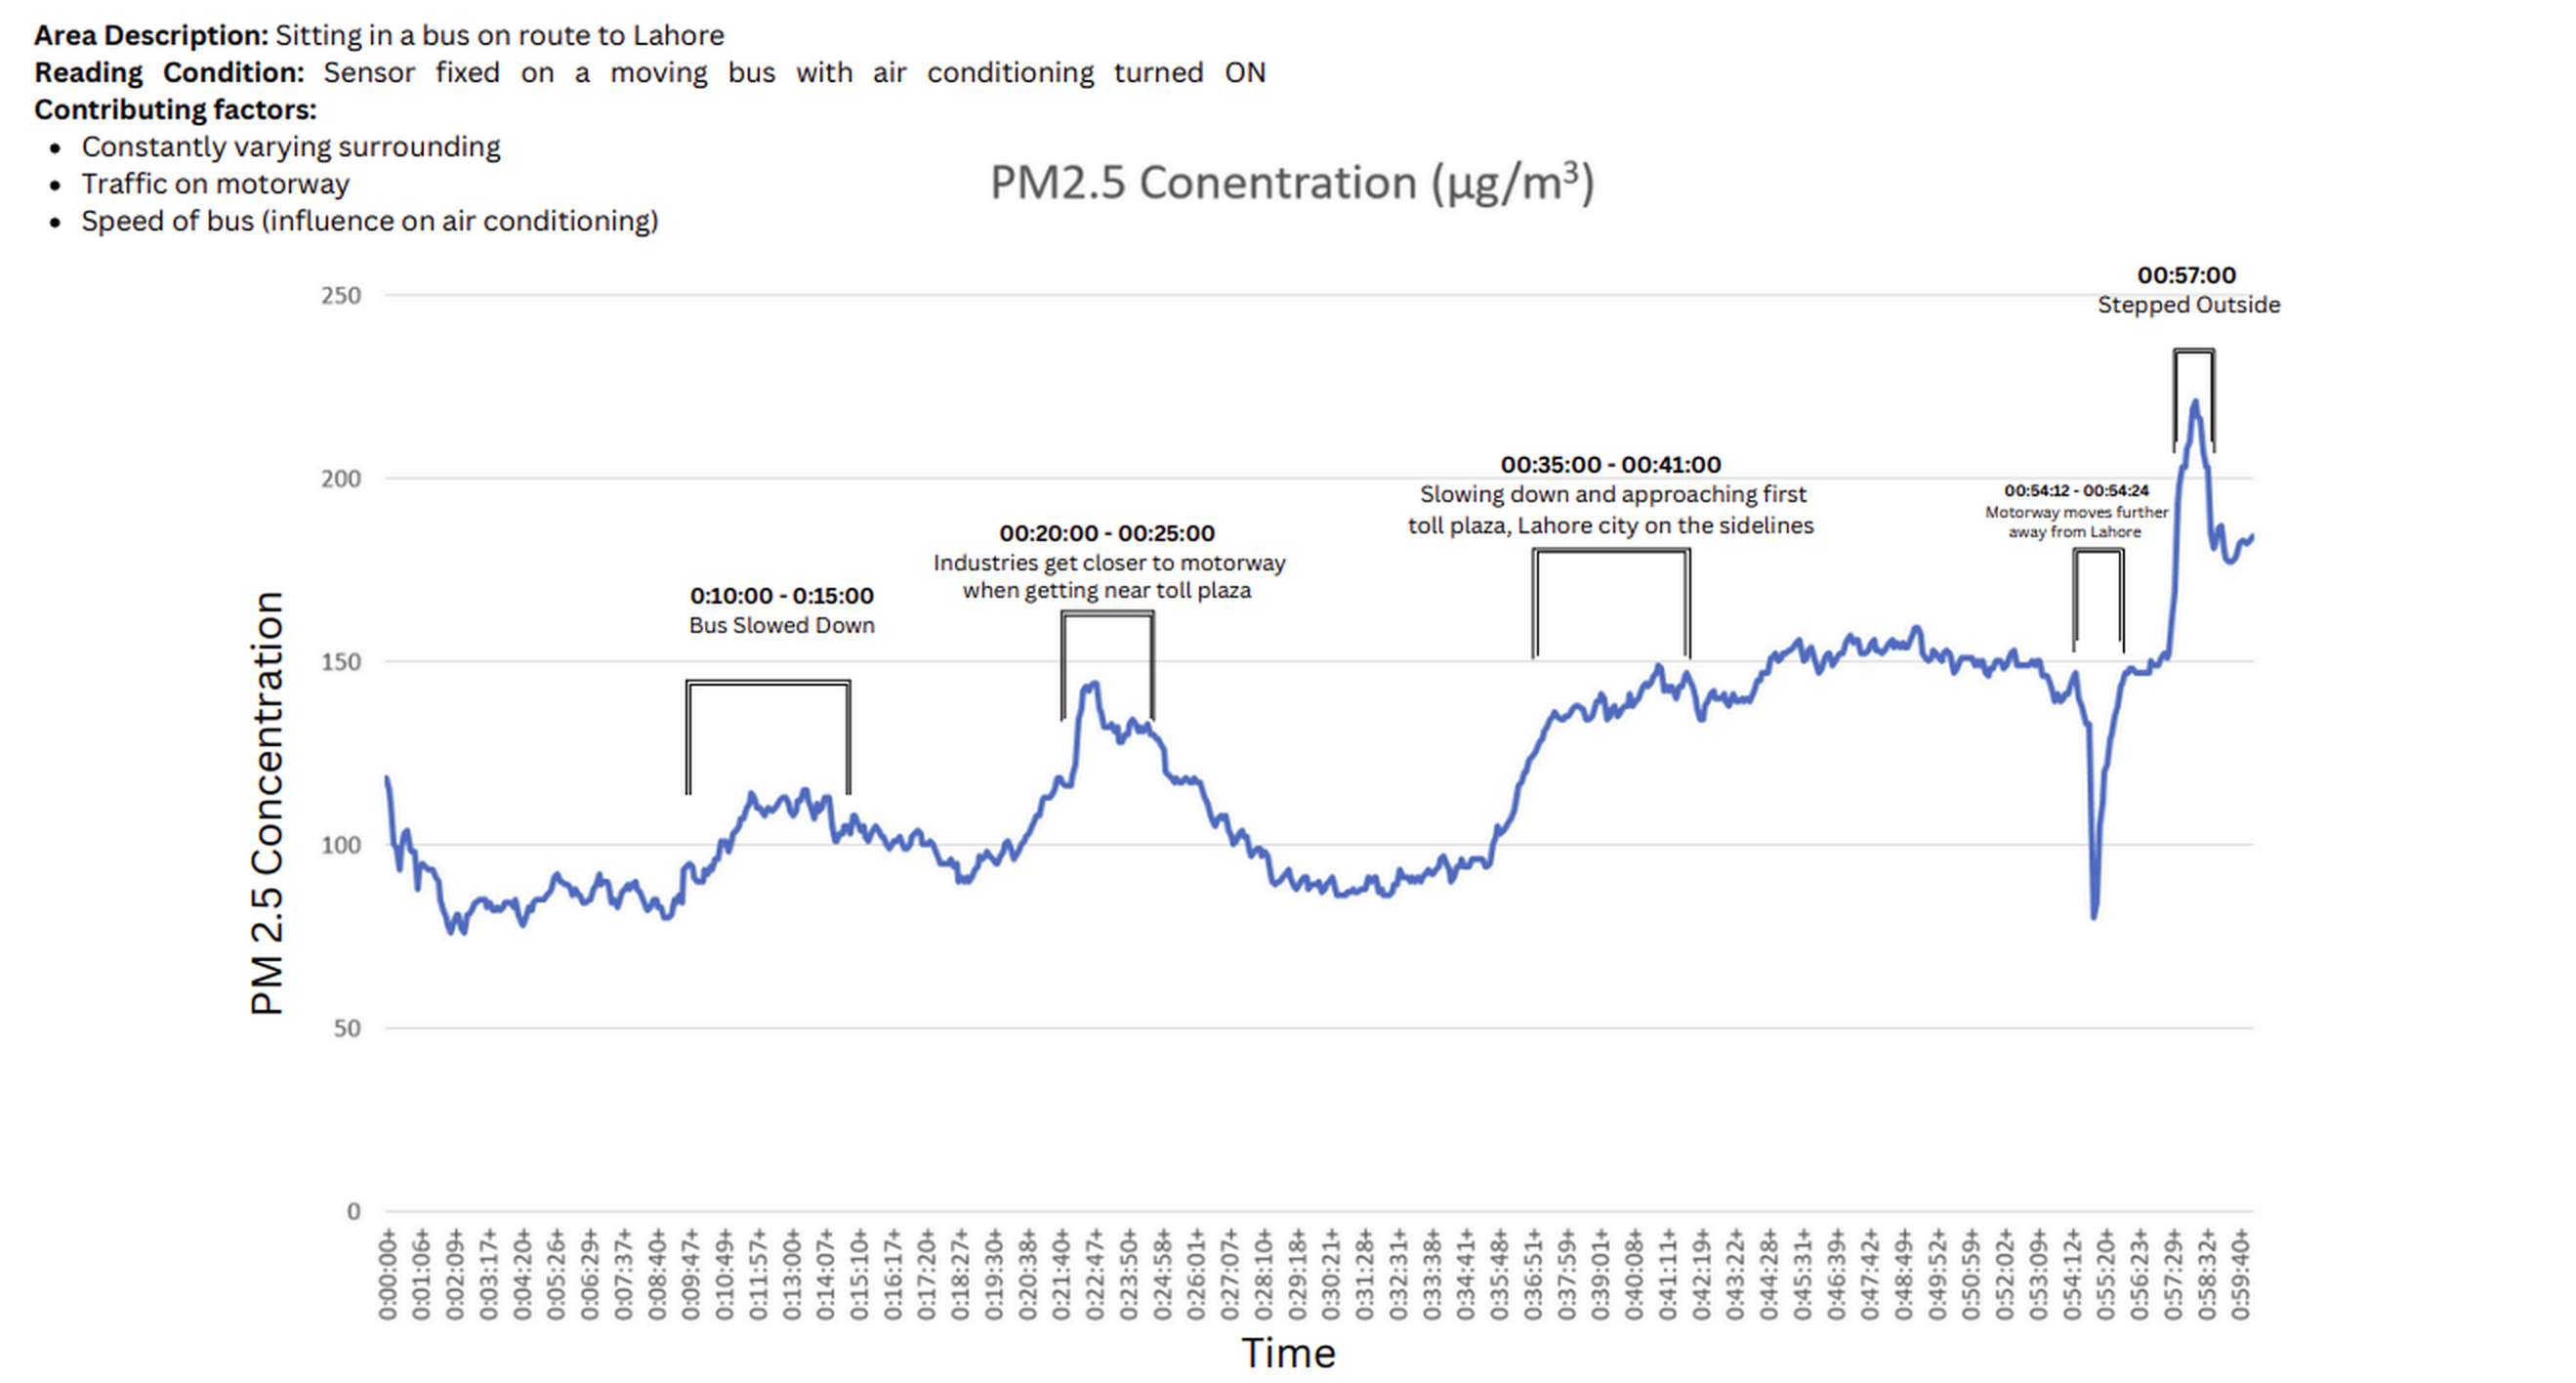
PM2.5 Concentration Levels Measured Inside a Moving Bus on Route to Lahore Under Varying Environmental Conditions.
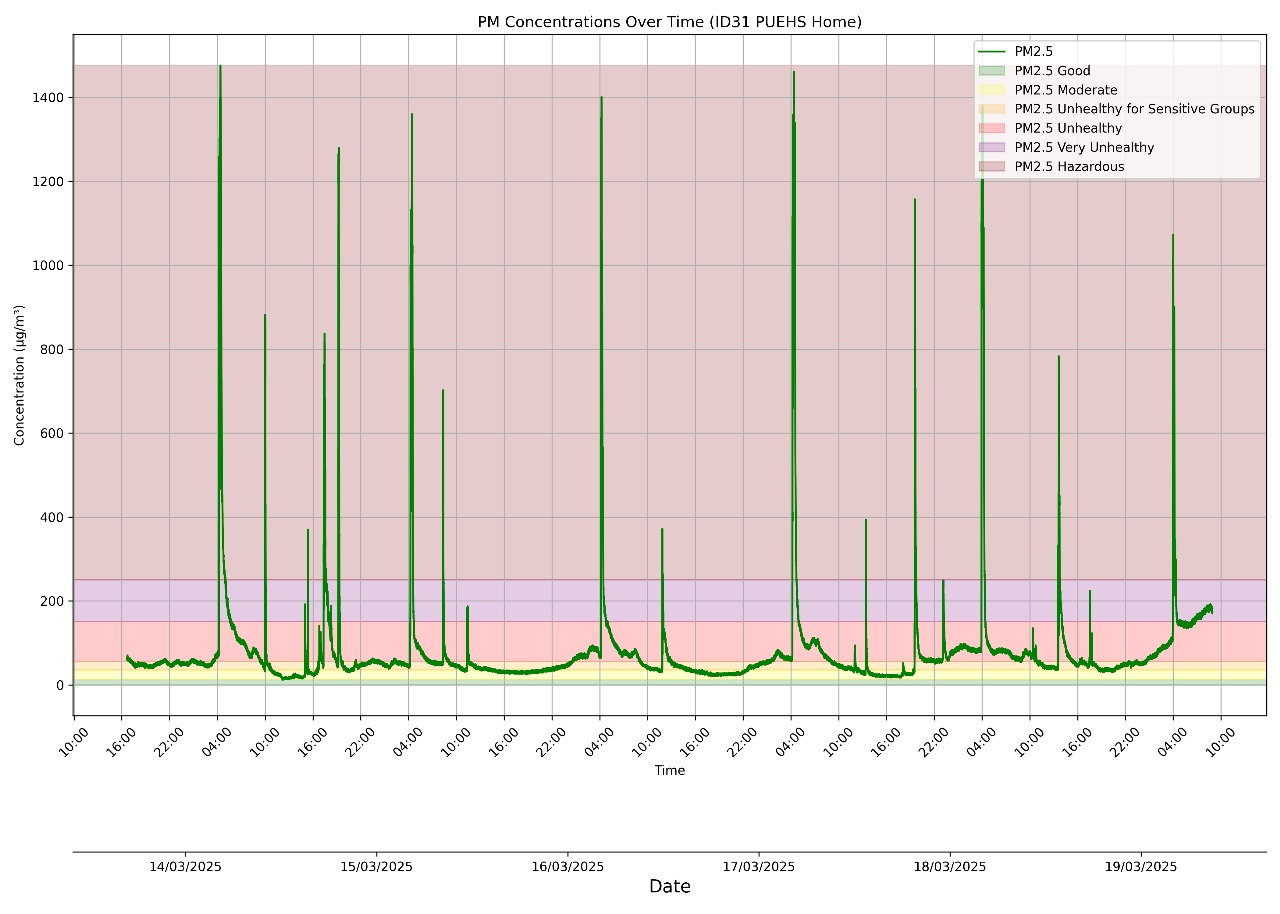
The accompanying picture shows the variation of PM2.5 levels in a household kitchen where cooking takes place on an LPG stove. This was taken during March 2025 which was Ramadhan 1446 A.H. One can see the periodic regular shoots in PM2.5 levels at precisely 4 am. This is when cooking started. Most of the cooking is oil based. The sharp rise and the gradual decay is interesting. This is followed by regular peaks of daily cooking in the 9 am to 11 am time frame, followed by iftars around 5 to 6 pm. Iftars took place when the inhabitants of this household were at home, and did not decide to eat outside. On 15th of March, there was an iftar feast at this household, indicated by the extensive pre-evening peaks.
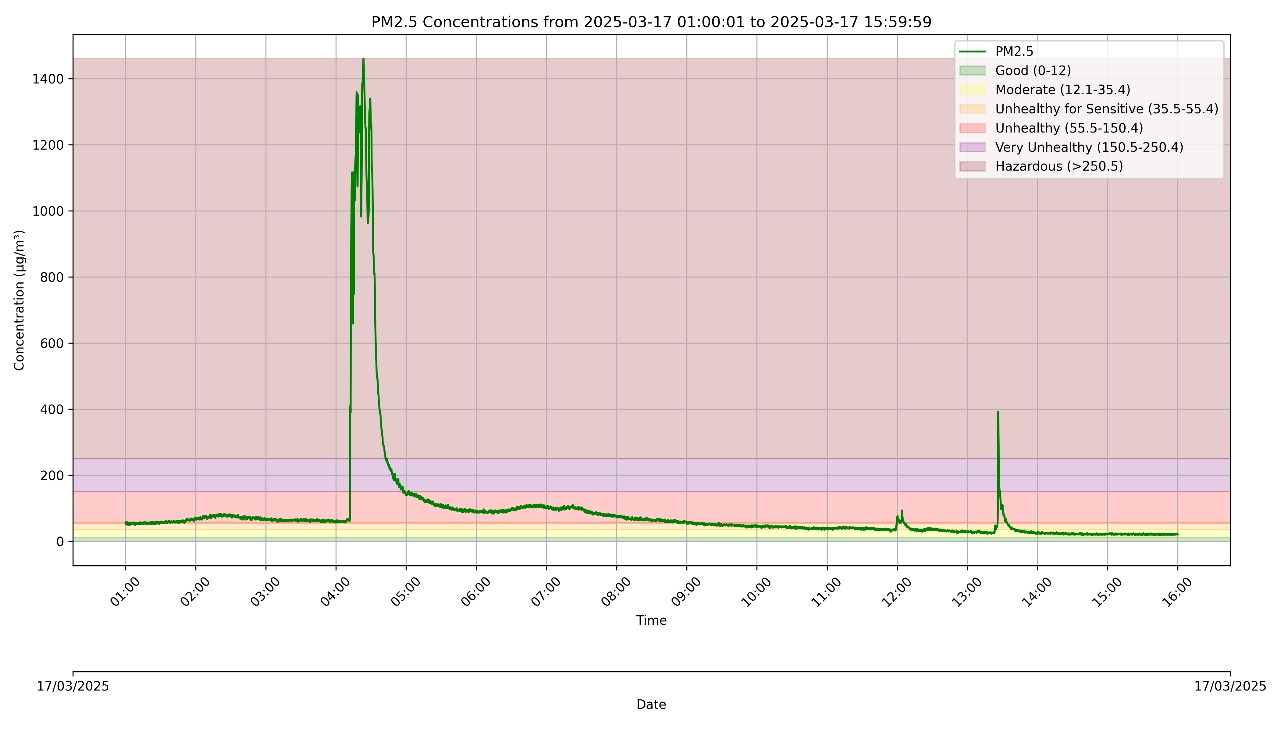
The closeup of the sharp peaks (see accompanying figure) indicates a rapid rise and gradual fall. The PM tracker enables fast measurements allowing one to track the dynamics of particle effusion; in fact, one can envisage many interesting micro experiments, such as speed of microparticles through time of flight measurements, correlation of PM concentrations with temperature, correcting PM values using simultaneous humidity and temperature measurements in the same box, testing quality of fuels through the emissions, especially meaningful given that the PM trackers also provide concentrations of some hazardous toxic gases.